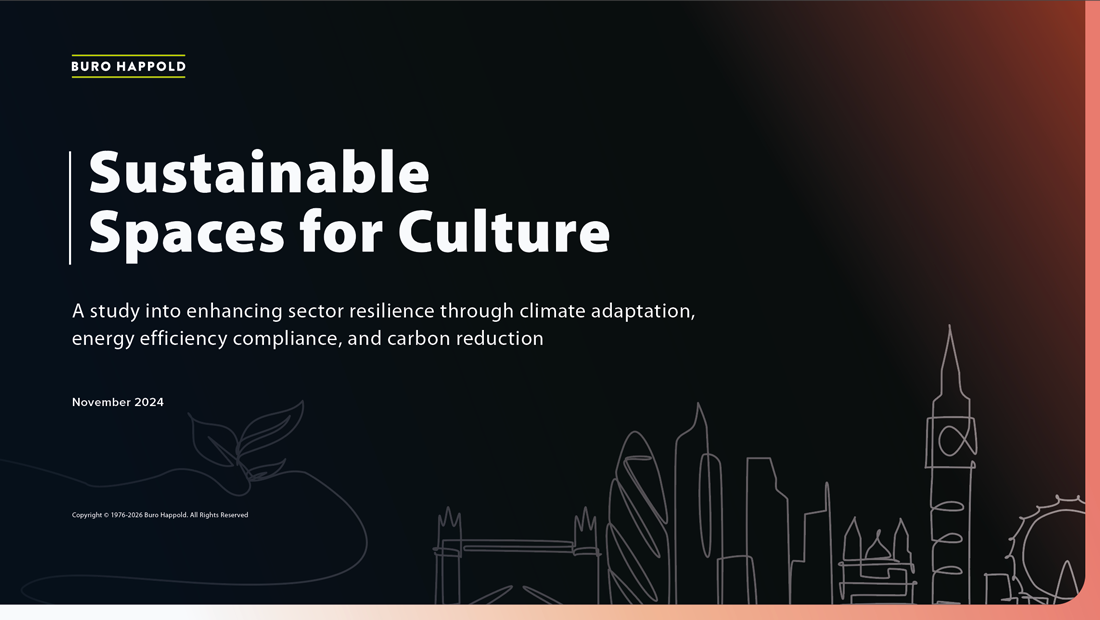
./Making climate risk visible
London’s cultural venues, from libraries and galleries to theatres, cinemas and creative workspaces, are essential community assets. Yet many face rising energy costs, overheating, flooding risk and the challenge of upgrading ageing buildings.
Working with Buro Happold’s Sustainability team, I helped shape a digital-first report for the Greater London Authority (GLA) and Arts Council England. The aim was to translate detailed technical research into an engaging, accessible resource that could support conversations around funding, policy and climate resilience across London’s cultural sector.
The challenge
The original report content contained extensive research, policy context, data analysis and venue-level case studies. It needed to retain technical rigour while becoming easier for a non-specialist, public-facing audience to navigate and understand.
The report also needed to work primarily on screen, follow Greater London Authority accessibility requirements, and make its most important messages immediately clear. This meant creating a strong reading hierarchy, reducing unnecessary density, and using colour, typography and information design with care.
The project was particularly important because the research examined more than buildings alone. Cultural venues provide spaces for learning, social connection, creative work and, during periods of extreme heat, refuge for local communities. The design therefore needed to communicate the practical risks facing the sector as well as the social value at stake
Research and direction
We began with a collaborative briefing session with the Sustainability team to understand the research, intended audiences and communication priorities.
The team reviewed the draft content, tested the structure and identified opportunities to make the narrative clearer. We worked closely with the authors to reduce and reshape copy, establish concise page-level content limits, and create a more intuitive sequence of information. This iterative approach continued throughout development, with visual and content decisions tested through shared reviews and feedback sessions.
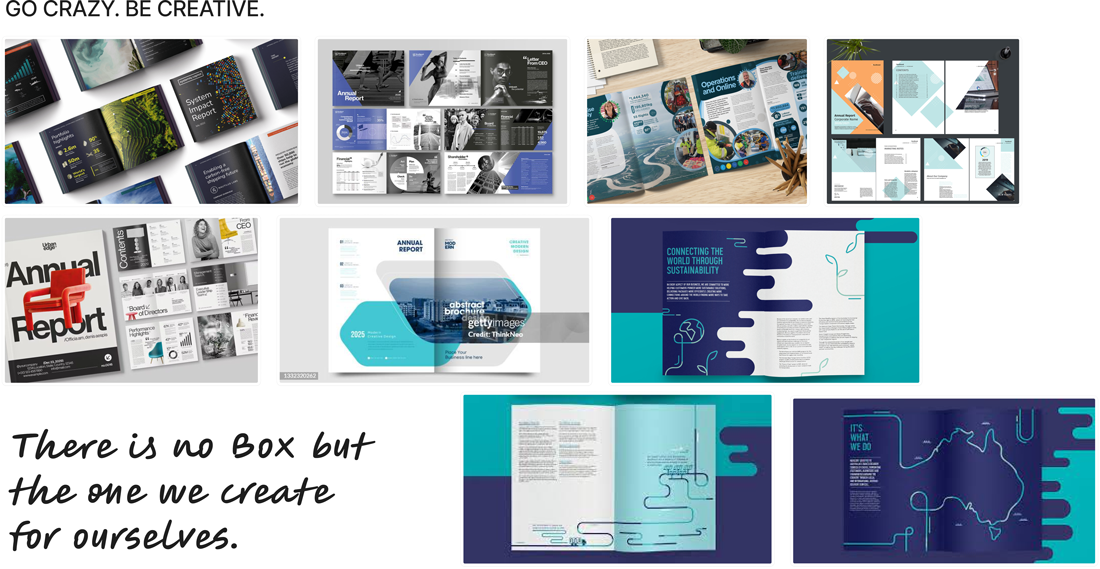
Rather than treating the report as a conventional technical document, we explored how a more editorial, visual approach could make the evidence feel approachable without compromising its authority.
Designing the visual system
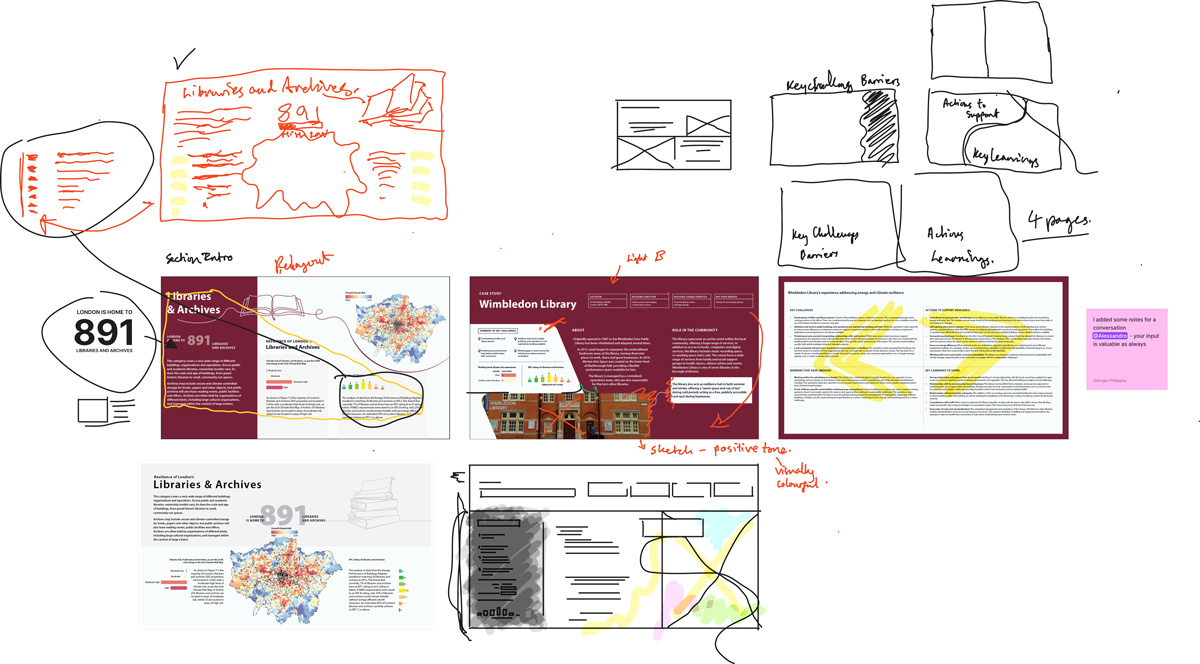
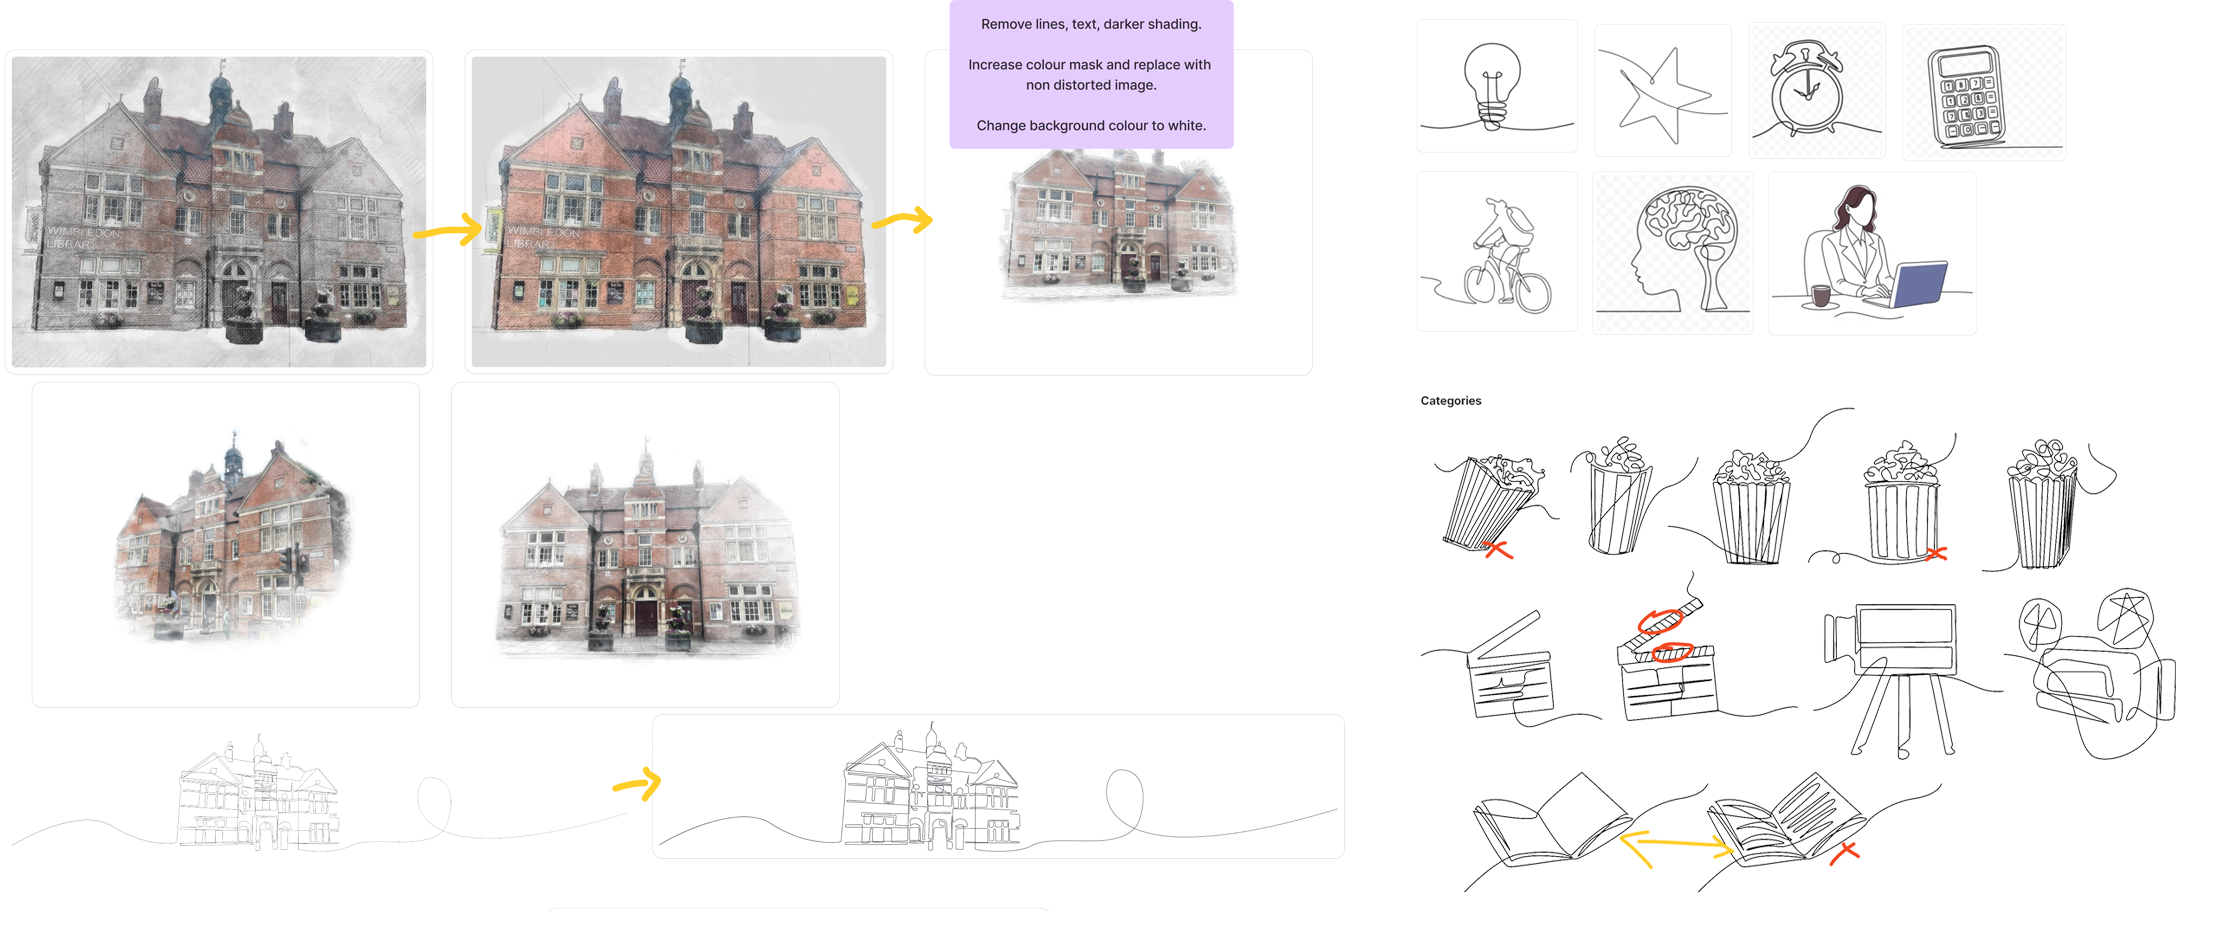
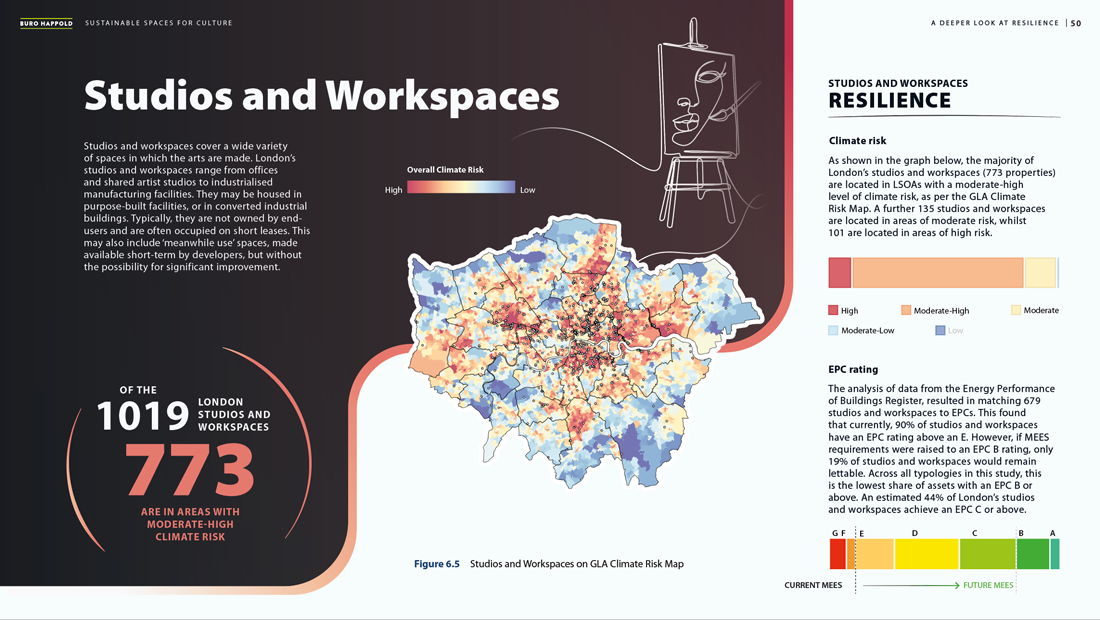
The selected direction combined soft curves, single-line illustrations and photographic imagery to create a visual language that felt connected to London’s cultural landscape. The system brought warmth and personality to a technically detailed subject, while keeping the content structured and easy to scan.
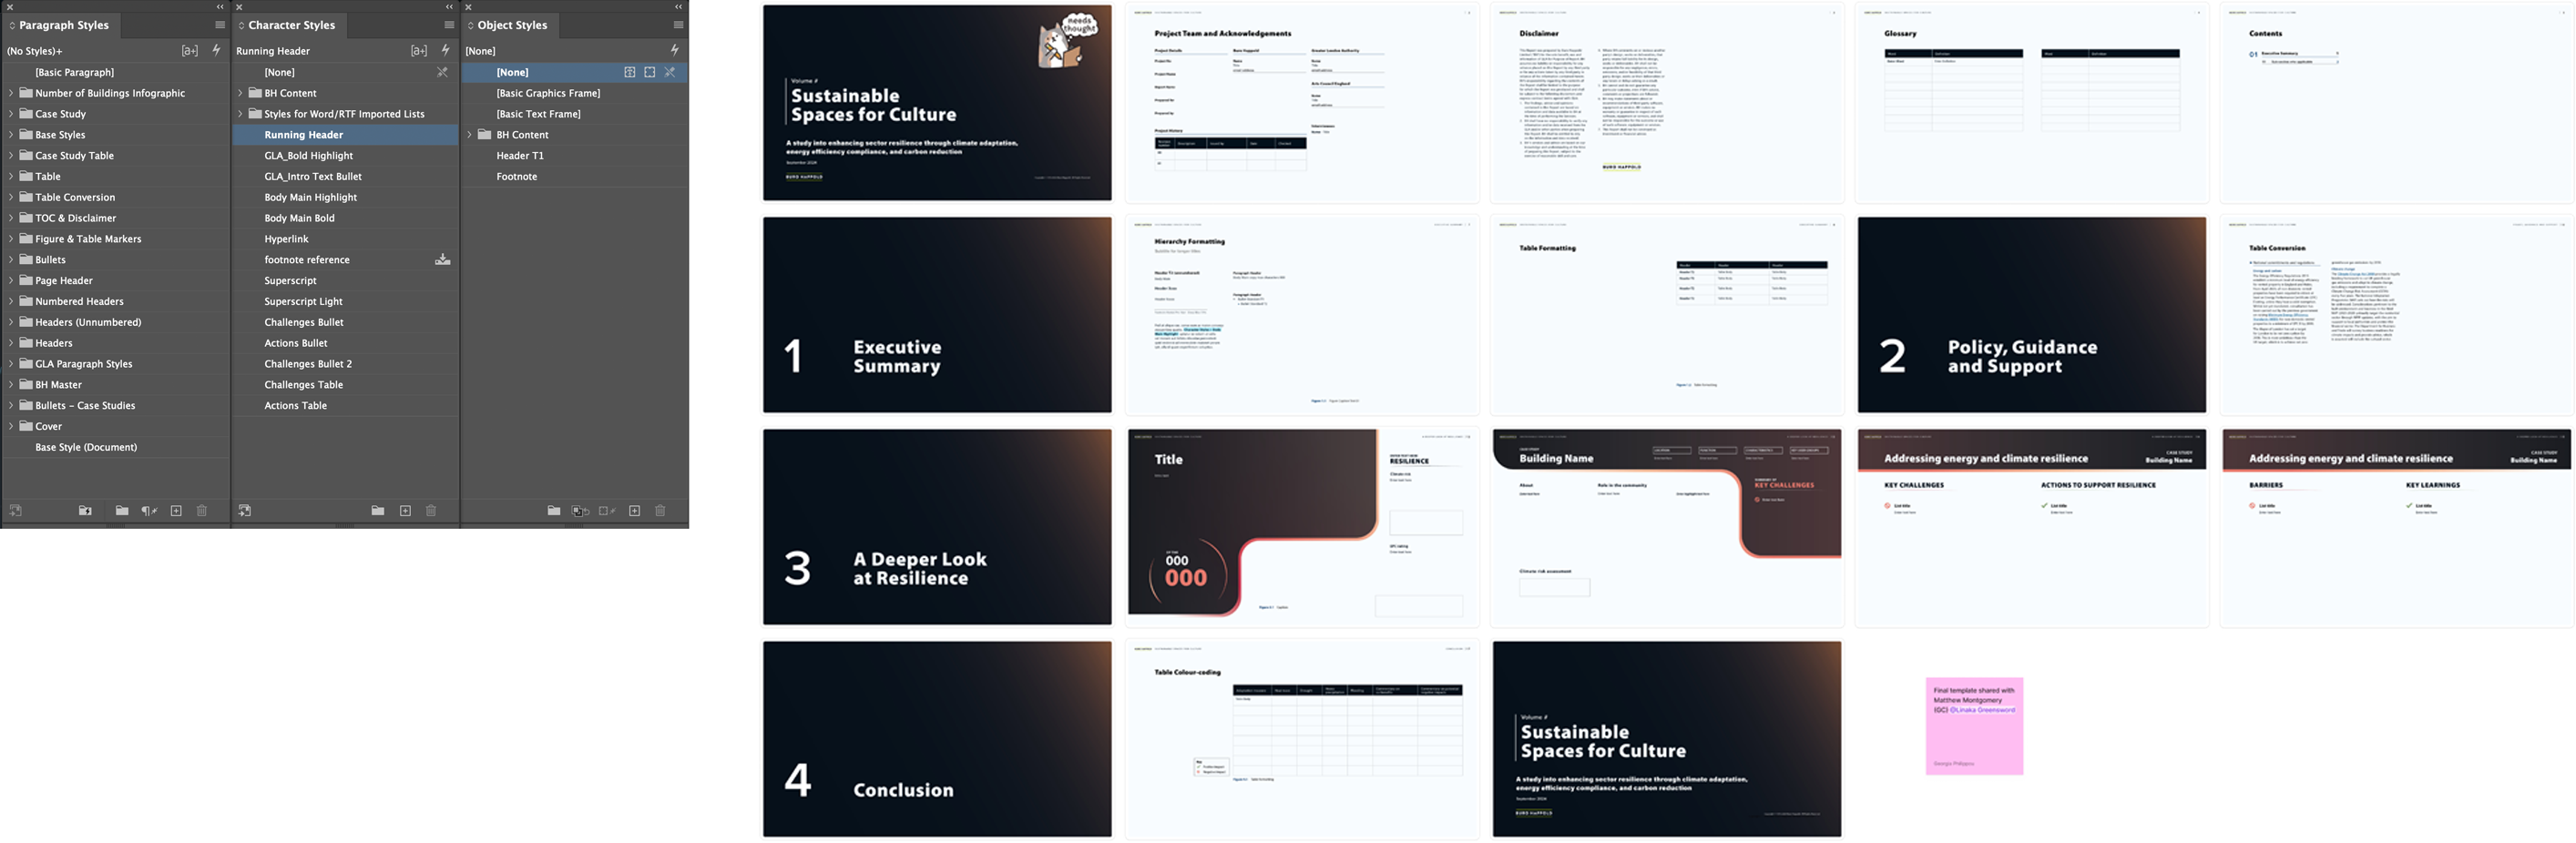
A flexible InDesign template and expanded set of paragraph, character and object styles supported consistent delivery across the report. This gave the team a practical framework for headings, body copy, statistics, diagrams, case-study content and recommendations, helping the final document remain coherent as content evolved.
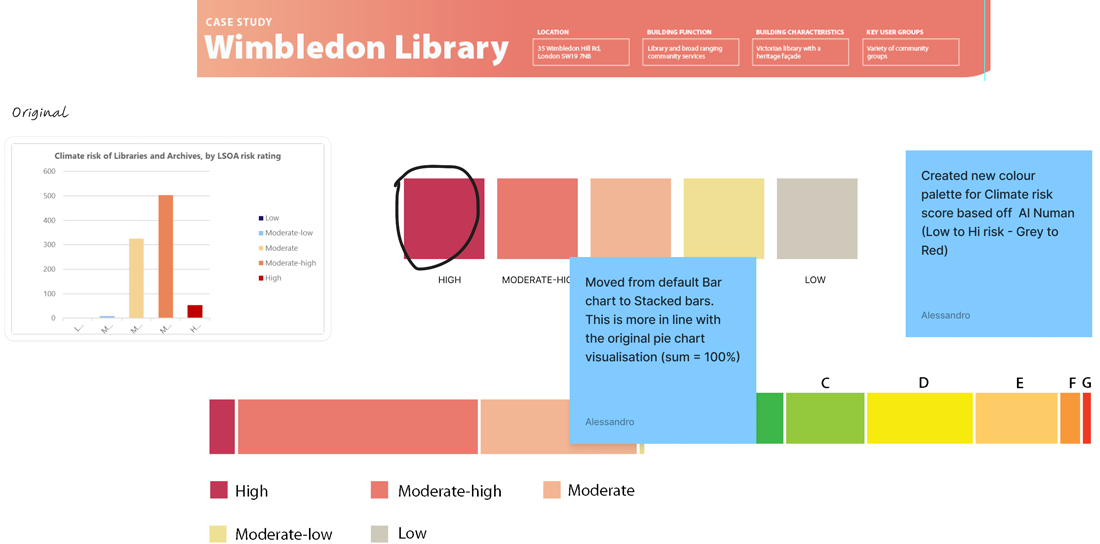
Colour was used deliberately, not decoratively. It reinforced the climate-risk and energy-performance information throughout the report, while respecting accessibility requirements and recognised rating conventions. In particular, the team retained the established colour logic for EPC ratings and climate-risk categories, so readers could interpret the data accurately and consistently.
Case studies and infographic
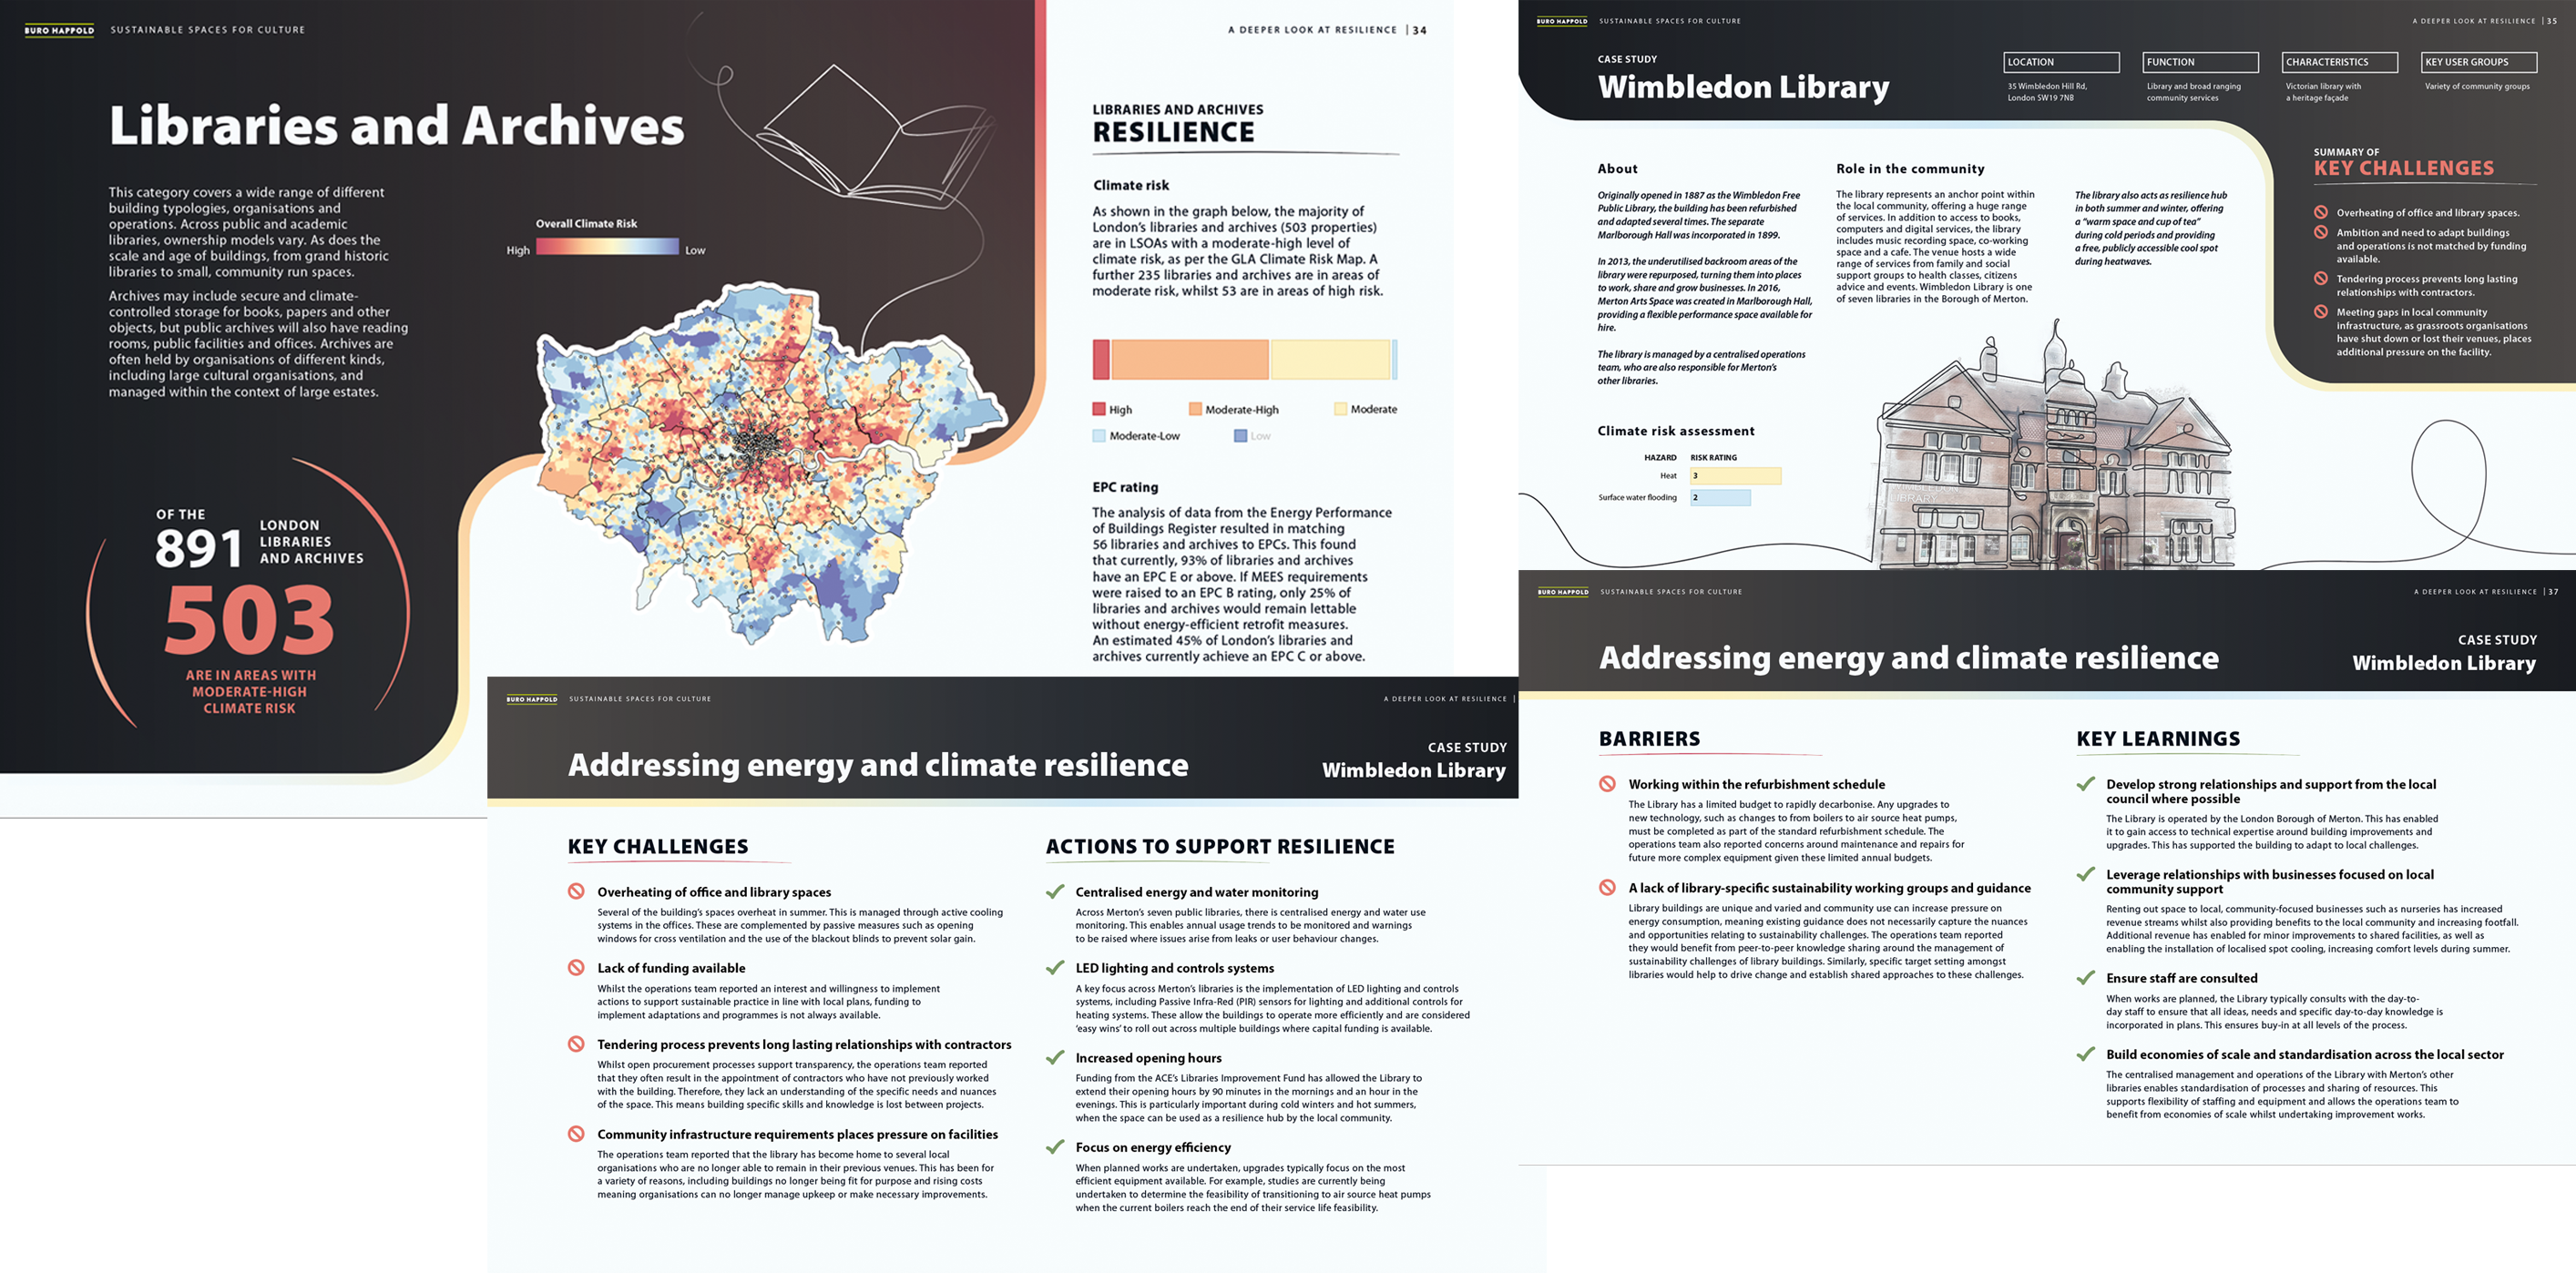
The report examined eight cultural building typologies, including cinemas, libraries and archives, multi-artform buildings, museums and galleries, music venues, studios and workspaces, theatre and dance rehearsal spaces, and theatre and dance venues. It combined London-wide analysis with individual venue case studies, including BFI Southbank, Wimbledon Library, the ICA, Serpentine Gallery, Wigmore Hall, SPACE Studios, Paddington Arts and the Bush Theatre.
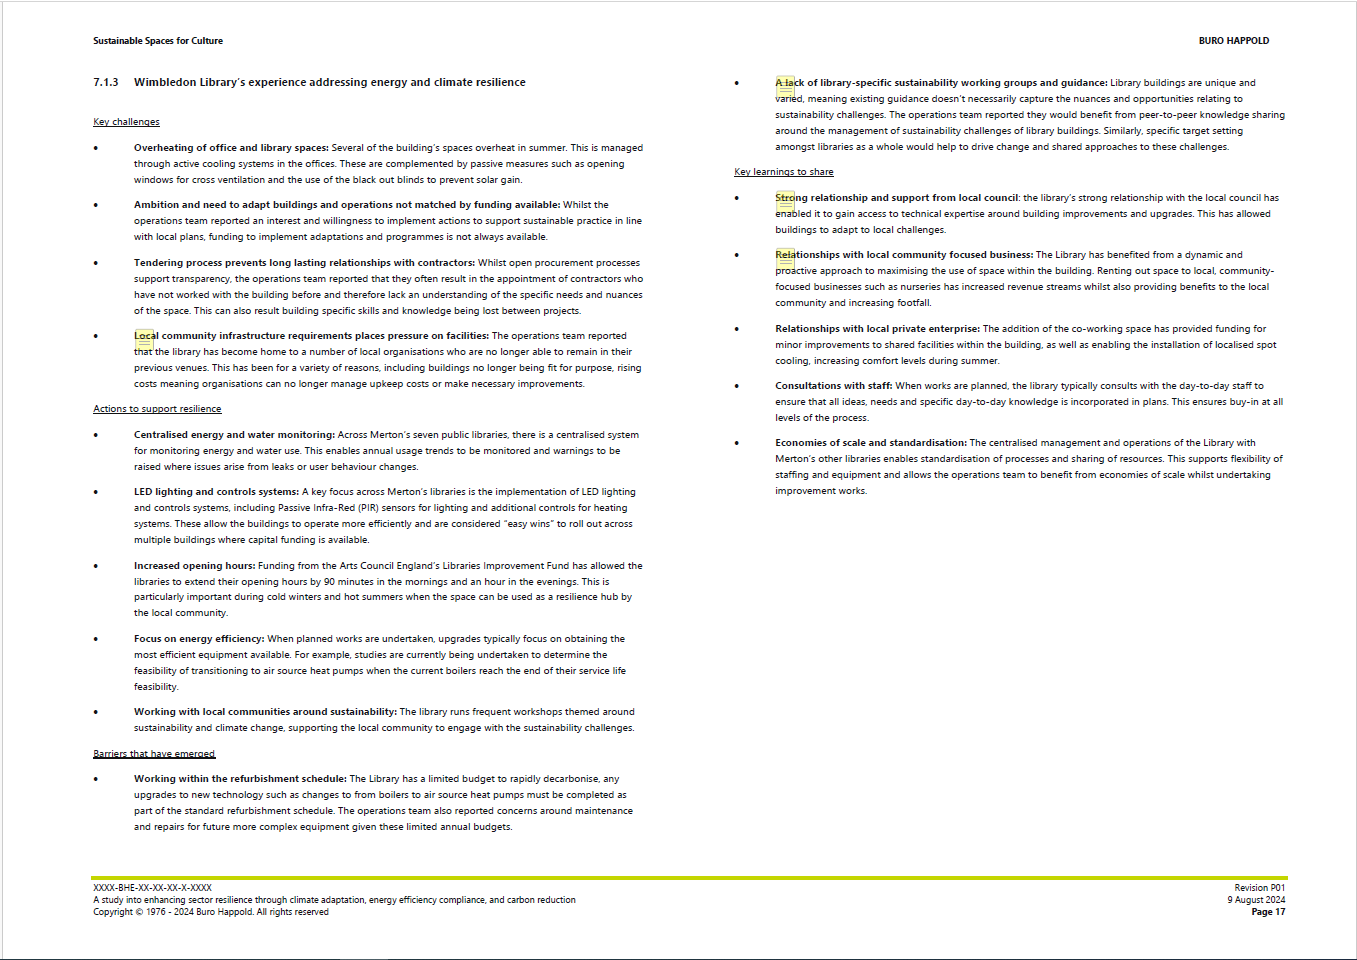
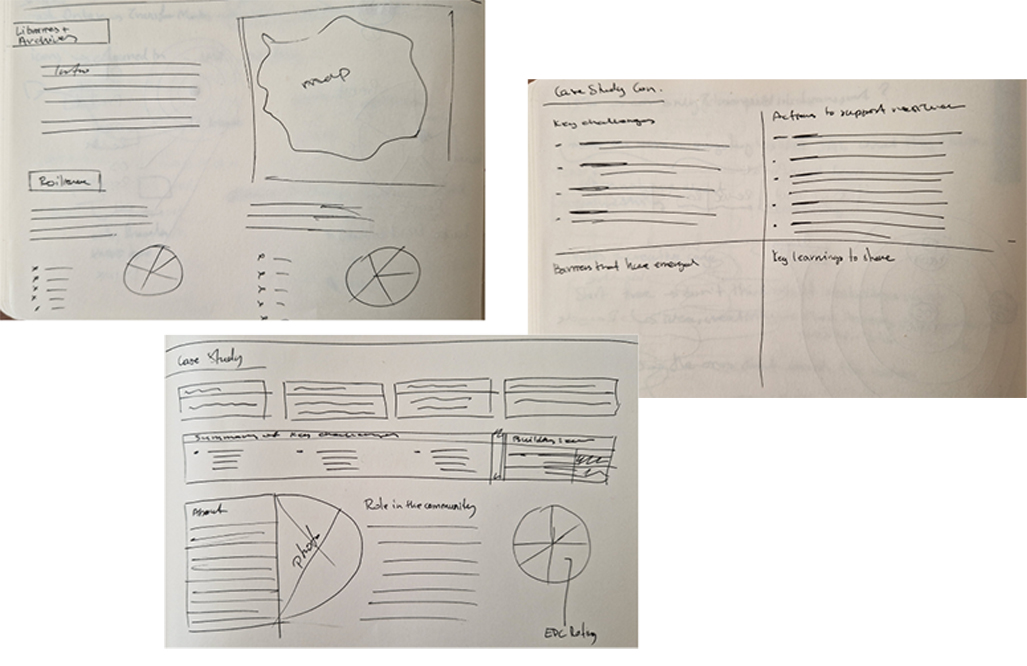
Each case study needed to explain the building’s role in its community, the risks it faced, possible resilience actions, barriers and lessons learned. We designed a consistent page framework that allowed readers to compare information across venues while giving each story sufficient space and identity.
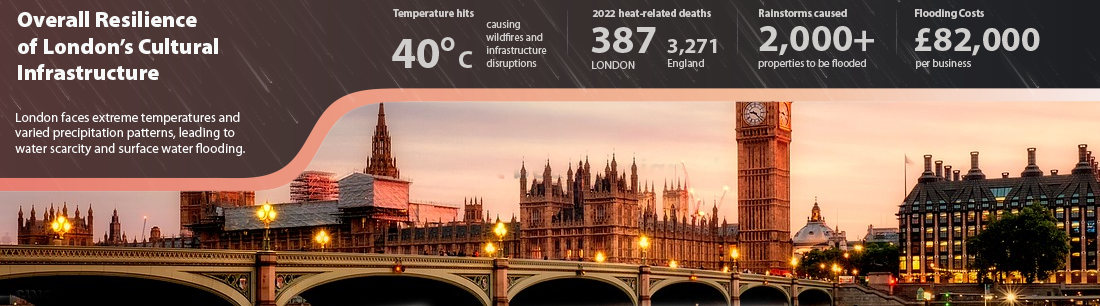
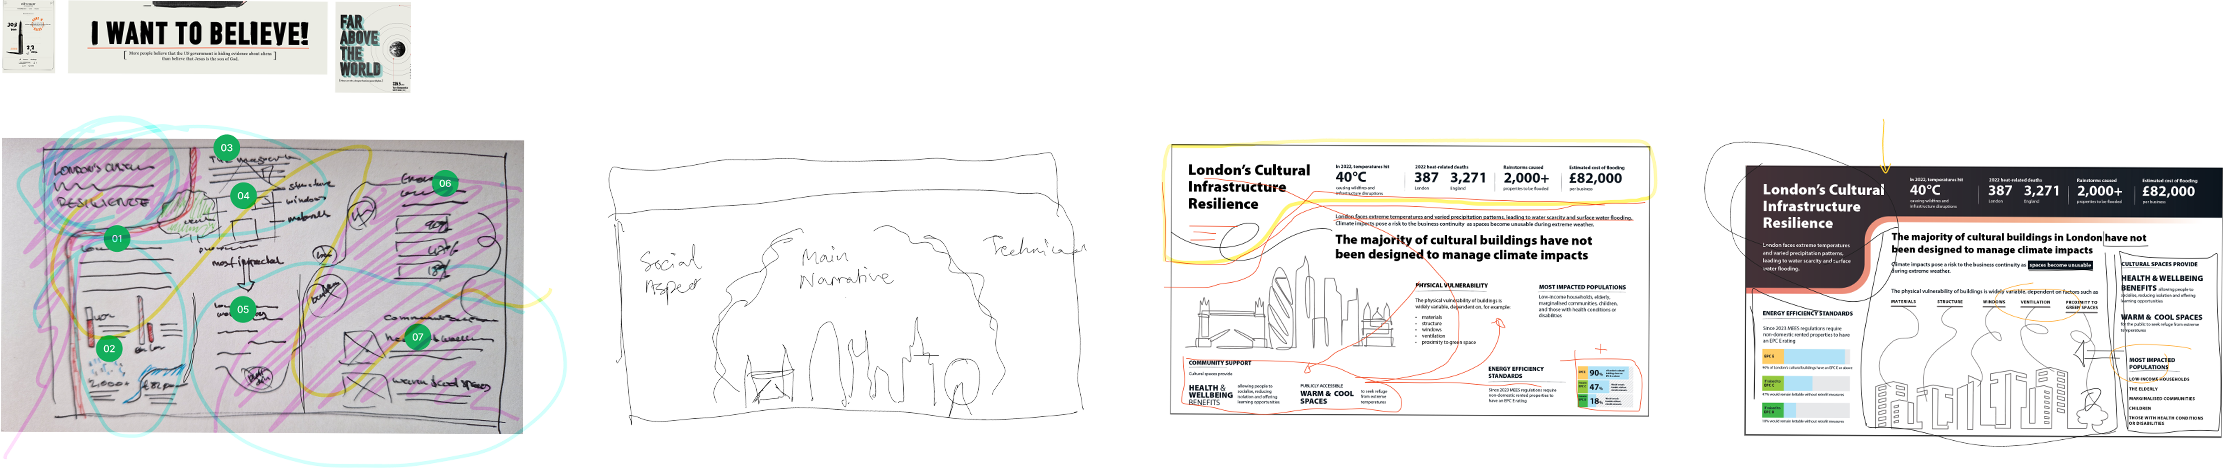
A key design focus was a single-page infographic summarising the state of London’s cultural infrastructure. It brought together climate impacts, EPC and energy-efficiency context, community value, public-health considerations and key sector statistics in one clear visual narrative. Hierarchy, reading flow and typography were tested in detail to ensure the page could be understood in the intended sequence. The client feedback specifically supported the use of strong header panels and the prioritisation of key challenges and community value.
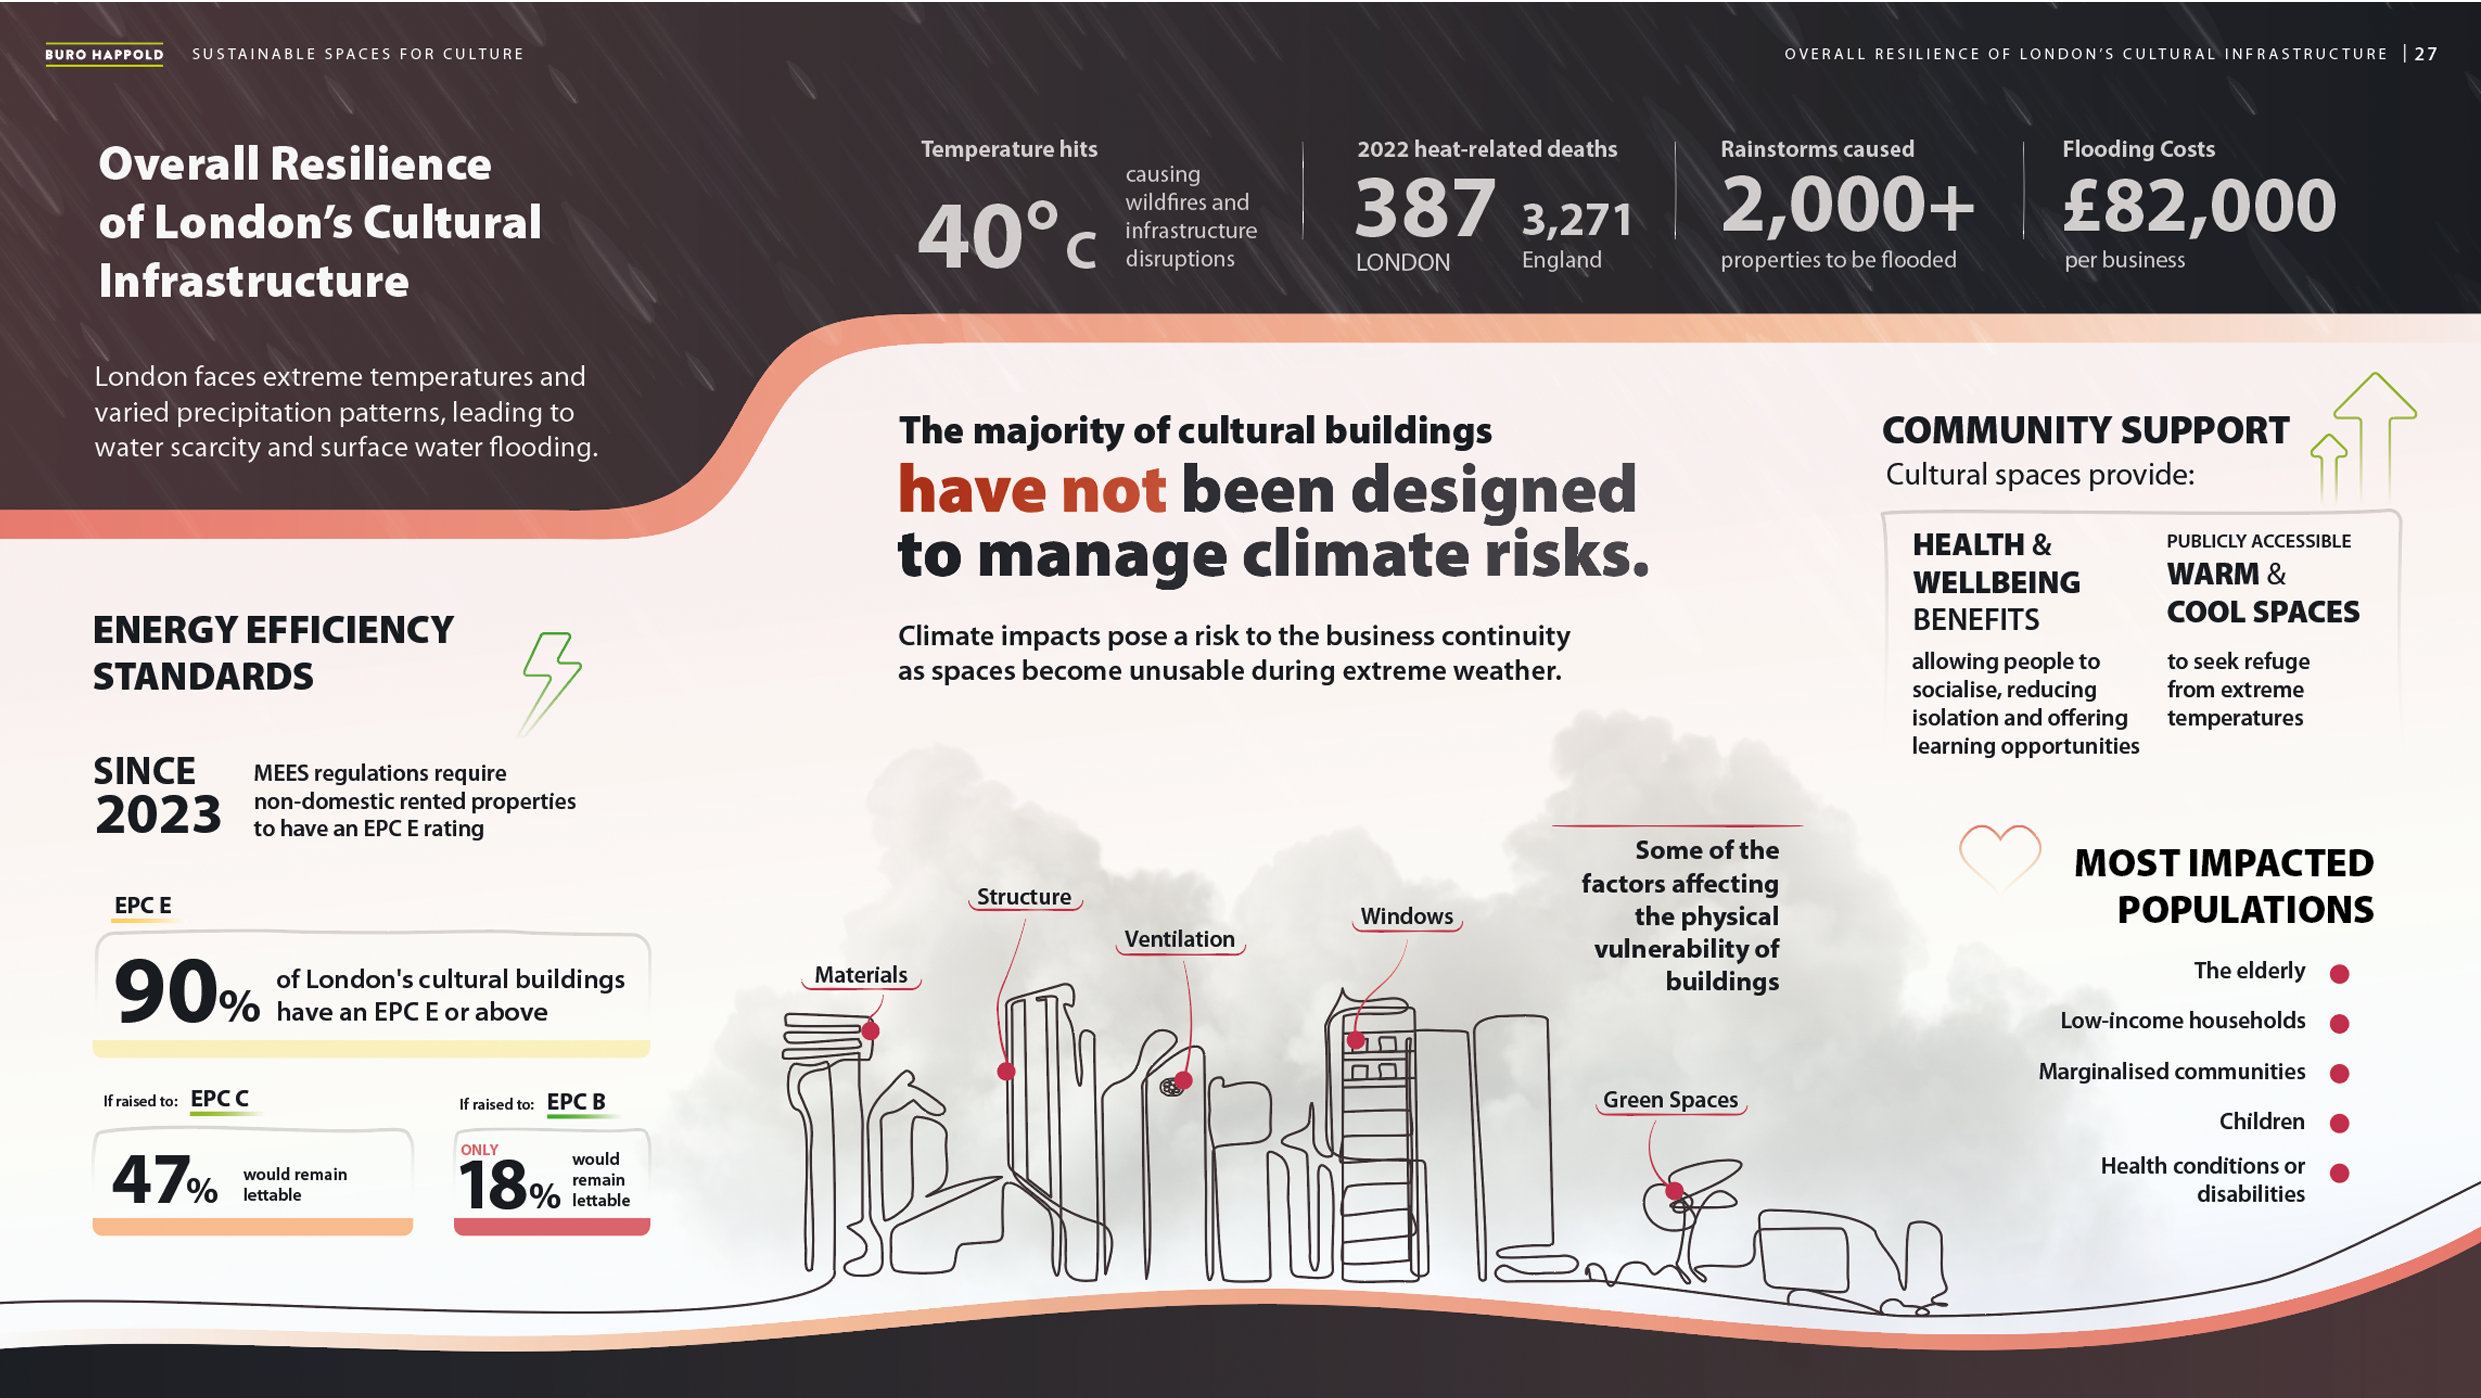
The final report created a more engaging, accessible and visually distinctive way to communicate complex climate and energy-resilience evidence. It gave the Sustainability team and client a reusable resource for presentations and conversations about cultural-sector resilience.
Although the report was not ultimately published on the GLA website as initially planned, its graphics and findings continued to be used in climate-resilience presentations. Internal feedback noted that audiences consistently responded positively to the visuals, while the client team described the draft design as taking the work “to another level.”